

 Processing
PrimeTime™ qPCR Probe Assays
Primer and probe premixed sequences for analyzing gene expression in any species using fluorescently labeled 5′ nuclease probes
PrimeTime qPCR Probe Assays consist of a primer pair and fluorescently labeled 5′ nuclease probe. Obtain predesigned sequences for human, mouse, or rat for easy selection based on multiple criteria such as exon location and number of transcripts. Create custom assays for any sequence from any species using the PrimerQuest™ Tool.
Ordering
- Predesigned sequences will achieve 90% efficiency or better, or we will replace with an alternative design free of charge.
- Select from a wide range of license-free dyes, including FAM, TET, SUN™, HEX, Cy® 5, Cy® 5.5, Yak™, Texas Red™, ATTO™ 647, and ATTO™ 425 dyes
- Multiplex with confidence using double-quenched ZEN™ or TAO™ probe assays
- Select a primer: probe ratio from 2:1 to 4:1 with no additional charge
- Size and scale options available for digital PCR (dPCR) platforms
- Receive primers and probe sequences with all orders
Have questions about PrimeTime qPCR Probe Assays?
We're here to help.
PrimeTime qPCR Probe Assays in tubes (1 probe/2 primers)
Available in various sizes, premixed, and shipped dried down.
|
Probes/primers supplied in the following ratios: 0.5/1.0 nmol (Mini); 2.5/2.5–10 nmol (Standard); 12.5/12.5–50 nmol (XL). You may specify the primer-to-probe ratio (except for PrimeTime Mini).
* Predesigned assays are available for human, mouse, and rat targets.
PrimeTime qPCR Probe Assays in 96-well plates (1 probe/2 primers)
Available in various sizes, premixed, and shipped dried down.
|
Probes/primers supplied in the following ratios: 0.5/1.0 nmol (Mini); 2.5/2.5–10 nmol (Standard); 12.5/12.5–50 nmol (XL). You may specify the primer-to-probe ratio (except for PrimeTime Mini). A minimum order of 24 assays is required per plate.
Available dye and quencher combinations for PrimeTime qPCR 5′ Nuclease Assays in plate well format
| 5' dye | 3' quencher | Mini | Standard | XL |
|---|---|---|---|---|
| FAM | ZEN™/Iowa Black™ FQ* | • | • | • |
| FAM | TAMRA | – | • | • |
| HEX | ZEN/Iowa Black FQ* | – | • | • |
| TET | ZEN/Iowa Black FQ* | – | • | • |
| Cy® 5 | Iowa Black RQ | – | • | • |
Key: • = available; – = not available
* ZEN/Iowa Black™ FQ is a Double-Quenched Probe, which provides superior performance compared to traditional single-quenched probes. For more information download the PrimeTime Custom qPCR Probes Flyer.
Product details
PrimeTime qPCR Probe Assays are offered in 3 different sizes to meet the needs of any qPCR experiment, which consist of a forward primer, a reverse primer, and a qPCR probe all delivered in a single tube or plate well. In addition, for the standard and XL sizes, dye–quencher combination and primer-to-probe ratio can be specified to meet your unique experimental demands. PrimeTime qPCR Probe Assays are made to order, and each oligonucleotide undergoes QC by mass spectrometry†. All QC results are provided free of charge to you on the IDT website.
- Primers and probe mixed and delivered in a single tube or 96-well plate well.
- Predesigned sequences will achieve 90% efficiency or better, or we will replace them with an alternative design free of charge. Available in 18 dye–quencher combinations and 3 reaction scales.
- MIQE compliant with all primer and probe sequences provided.
Predesigned sequences are available for human, mouse, and rat targets. These sequences are designed using a proprietary algorithm. In addition to optimized oligo melting temperature [Tm (based on composition, oligo length, etc.)], the bioinformatics calculations address avoidance of single nucleotide polymorphisms (SNPs; based on NCBI RefSeq releases) and off-target amplification, recognition of splice variants, and secondary structure predictions.
† With the exception of mixed base oligos, which could potentially represent multiple sequences and therefore cannot be accurately evaluated by ESI‑mass spectrometry.
Guarantee: Predesigned sequences will achieve 90% efficiency or better, or we will replace with an alternative design free of charge with the submission of supporting data. For more information, contact us.
Custom sequences can also be designed for other species, as well as human, mouse, and rat, using the PrimerQuest™ Tool. This tool may be used to design oligos for endpoint PCR, qPCR, and Sanger sequencing. Use our optimized preset design parameters for PCR and qPCR or customize parameters for your application. The PrimerQuest Tool is based on the Primer3 engine.
For commonly studied pathways in human, mouse, and rat species, we provide suggested gene sets (see Resources section below) that can be used with our PrimeTime plate ordering system.
Primer sequences are provided
We provide primer sequences with each order to assist with best practices in research reporting:
- Boosts publication credibility—you can publish you research according to the MIQE guidelines
- Helps identify and avoid SNPs
- Facilitates design of multiplex experiments
- Assists with data interpretation and troubleshooting
- Allows you to valid your transcripts
Product data
PrimeTime qPCR Probe Assays provide reliable results
To demonstrate the performance of different dye-quencher combinations, we tested a dilution series to evaluate PCR efficiency and R2 values across all dye-quencher combinations available (Figure 1).
| Dye-quencher combination | FAM/ZEN/Iowa Black FQ | Sun/ZEN/Iowa Black FQ | HEX/ZEN/Iowa Black FQ | TET/ZEN/Iowa Black FQ | Cy5/TAO/Iowa Black RQ |
|---|---|---|---|---|---|
| Amplification curve |  |  |  |  |  |
| Standard curve |  |  |  |  |  |
| Efficiency | 97.4 | 99.7% | 98.4% | 97.2% | 95.0% |
| Correlation coefficient (R²) | 0.997 | 0.998 | 0.997 | 0.998 | 0.999 |
Figure 1. Demonstrated assay performance with multiple dye–quencher combinations. A gBlocks Gene Fragment dilution series of the HPRT gene was used to test different dye-quencher combinations. The data show PCR efficiency and R2 values close to 1 across all dye/quenchers available for PrimeTime qPCR Assays. All reactions were run using IDT’s PrimeTime Gene Expression Master Mix under standard two step cycling conditions 95°C for 3 min, (95 °C for 15 sec + 60°C for 1 min) x 40 on the QuantStudio™ 7 Flex (Thermo Fisher Scientific) 386 well format. Reactions were 10 µL in volume and contained 500 nM primers and 250 nM probe. The PrimeTime Gene Expression Master Mix was used with low ROX reference dye.
Compatibility with commercially available master mixes
To determine the success of PrimeTime qPCR Probe Assays with commercially available master mixes, we tested 5 different master mixes over a dilution series of 6 orders of magnitude (Figure 2). The PrimeTime qPCR Probe Assays had efficiency close to 100% across many commercially available master mixes. We have also developed the PrimeTime Gene Expression Master Mix for use with PrimeTime probe-based assays in two-step RT-qPCR.
| Product | Qiagen QuantiNova Probe PCR Kit | Thermo Fisher Scientific TaqMan Fast Advanced | Bio-Rad Sso Advanced | Aligent Stratagene Brilliant II® | Takara Premix Ex Taq | IDT Gene Expression Master Mix |
|---|---|---|---|---|---|---|
| Amplification curve |  |  |  |  |  | 
|
| Standard curve |  |  | |  | 
|  |
| Efficiency | 102.1% | 98.6% | 99.8% | 98.0% | 101.8% | 99.1% |
| Correlation coefficient (R²) | 0.998 | 0.998 | 0.996 | 0.996 | 0.999 | 0.998 |
Figure 2. Successful amplification of PrimeTime qPCR Probe Assays with various commercial qPCR master mixes. A 10-fold dilution series over 6 orders of magnitude (1 x 10⁶ to 1 x 101 copies) was created for the HPRT1 transcript. The standard curves were generated by running the assay with the indicated commercial master mixes. The samples were run on a Thermo Fisher Scientific QuantStudio™ 7 Flex instrument under standard cycling conditions for 40 cycles. The data shows greater than 90% efficiency and correlation coefficients greater than 0.99 for all tested qPCR master mixes.
Low variability between assay lots and across assay scales
PrimeTime qPCR Probe Assays have low variability from lot to lot and across scales, which supports your research needs for re-ordering consistent assays and for transitioning from discovery or validation applications to screening. We tested 5 genes from 2 lots each of mini, standard, and XL PrimeTime qPCR Probe Assays. The assays showed consistency between lots and across all 3 scales with negligible Cq variation (Figure 3).
| Gene ID | ||||||
|---|---|---|---|---|---|---|
| HPRT1 | PGK1 | RPLP0 | UBC | WDR3 | ||
| Mini | Replicate 1 | 27.1 | 23.7 | 21.1 | 21.8 | 26.7 |
| Replicate 2 | 27.1 | 23.7 | 21.1 | 21.8 | 26.6 | |
| Standard | Replicate 1 | 27.2 | 23.7 | 21.1 | 21.6 | 26.5 |
| Replicate 2 | 26.9 | 23.5 | 21.1 | 21.6 | 26.4 | |
| XL | Replicate 1 | 27.1 | 23.5 | 21.0 | 21.3 | 26.4 |
| Replicate 2 | 27.0 | 23.5 | 21.1 | 21.4 | 26.3 | |
| Amplification curves |  |  |  |  |  | |
Figure 3. PrimeTime qPCR Probe Assays are consistent from lot to lot and across scales. Reverse transcription of qPCR Human Reference total RNA (Agilent) was performed using oligo(dT), random hexamers, and SuperScript® II (Thermo Fisher Scientific). Each qPCR reaction contained 50 ng of cDNA. All assays were run in duplicate on the CFX384 Touch Real-Time PCR system (BioRad) for 45 cycles using the PrimeTime Gene Expression Master Mix. The Cq values for the 2 replicates are shown. Assays for 5 genes were formulated as PrimeTime Mini, Standard, and XL qPCR Assays.
Dynamic range down to 10 copies
To show the dynamic range for PrimeTime qPCR Probe Assays, we tested a dilution over 6 orders of magnitude down to 10 copies per reaction (Figure 4). All dilutions tested produced highly consistent results.
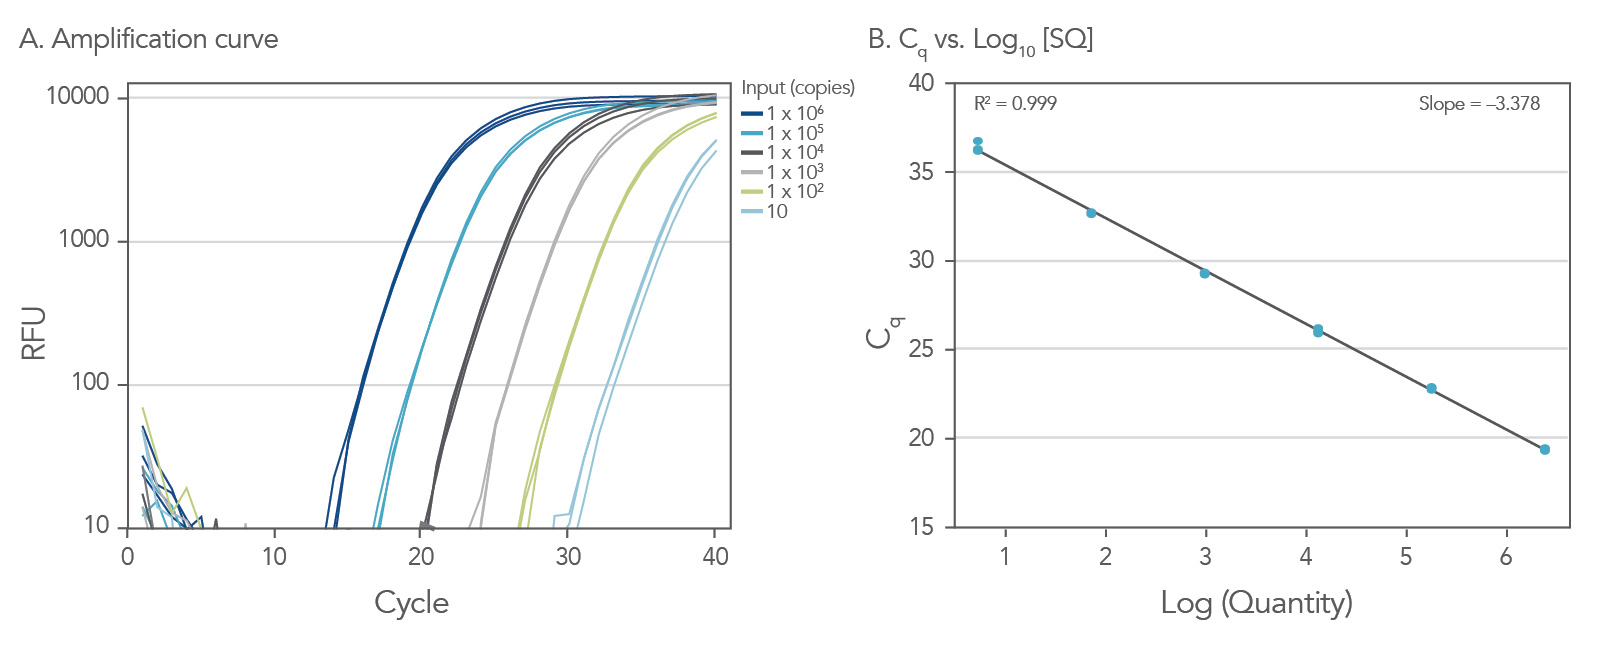
Figure 4. Dynamic range (6 logs) down to 10-copies. An HPRT PrimeTime qPCR Probe Assay was analyzed by utilizing a gBlock Gene Fragments dilution series and a no template control (NTC). The data shown illustrates 6 logs of dynamic range and assay down to 10 copies per reaction. The efficiency of the assay calculated from the standard curve is 97.6% with a correlation coefficient of 0.9991.
PrimeTime qPCR Probe Assays excel with fast-cycling protocols
Fast cycling allows for higher throughput and faster access to results. Unfortunately, researchers often have to sacrifice performance for speed. PrimeTime qPCR Probe Assays were tested using the PrimeTime Gene Expression Master Mix, which allows run times as short as 45 minutes. These results were compared to 30 matched, inventoried assays from a competitor.
- Greater low copy input limit─twelve out of the sixteen PrimeTime qPCR Probe Assays had lower Cq values compared to matched, inventoried assays from a competitor.
- No sacrifice in efficiency─all PrimeTime Assays maintained efficiencies of 90–105%.
Lower mean Cq values
Sixteen assays from a competitor were compared to an equal number of PrimeTime qPCR 5' Nuclease Assays. To ensure the assays were comparable, the PrimeTime Assays and Competitor assays were selected to span the same exon boundary of each gene. The reactions were run with the PrimeTime Gene Expression Master Mix and identical thresholds were set for all runs (Figures 5).
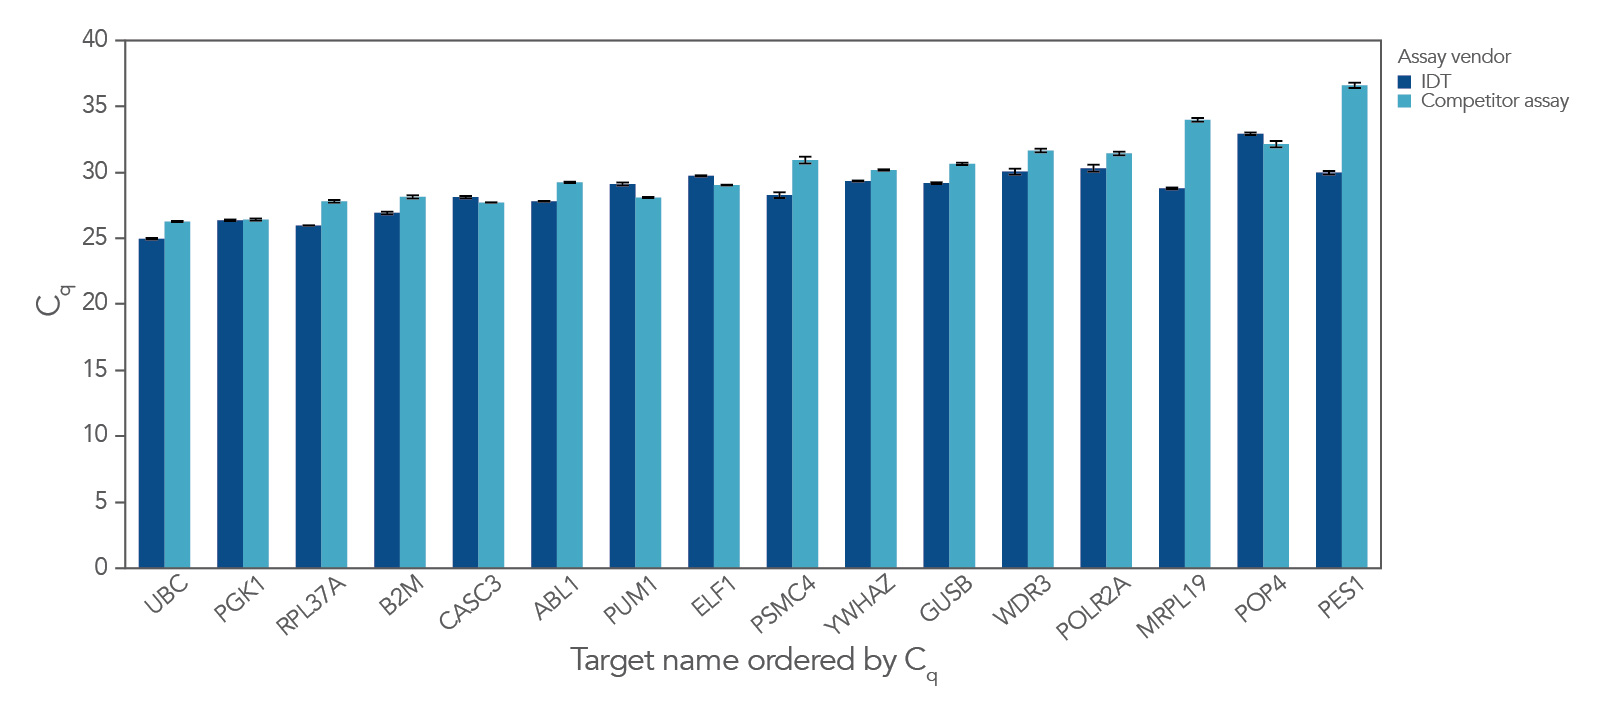
Figure 5. PrimeTime qPCR Assays have consistently lower mean Cq values for the same target. PrimeTime qPCR Assays were compared to matched Competitor assays using five, 4-fold dilutions of cDNA and the PrimeTime Gene Expression Master Mix. The reactions were run on the CFX384 Touch Real-Time PCR system (BioRad) for 45 cycles with the following PCR cycling conditions: 2 min 50°C; 10 min 95°C; 45 x (15 sec 95°C, 1 min 60°C). Identical thresholds were set for all runs for comparison across assays.
Higher qPCR efficiency
qPCR efficiency was compared using 30 PrimeTime qPCR Probe Assays and Competitor A assays (Figure 6). Again, the PrimeTime qPCR Assays showed a higher average qPCR efficiency than Competitor assays. In addition, the overall distribution of qPCR efficiency was narrower and higher than that for Competitor assays.
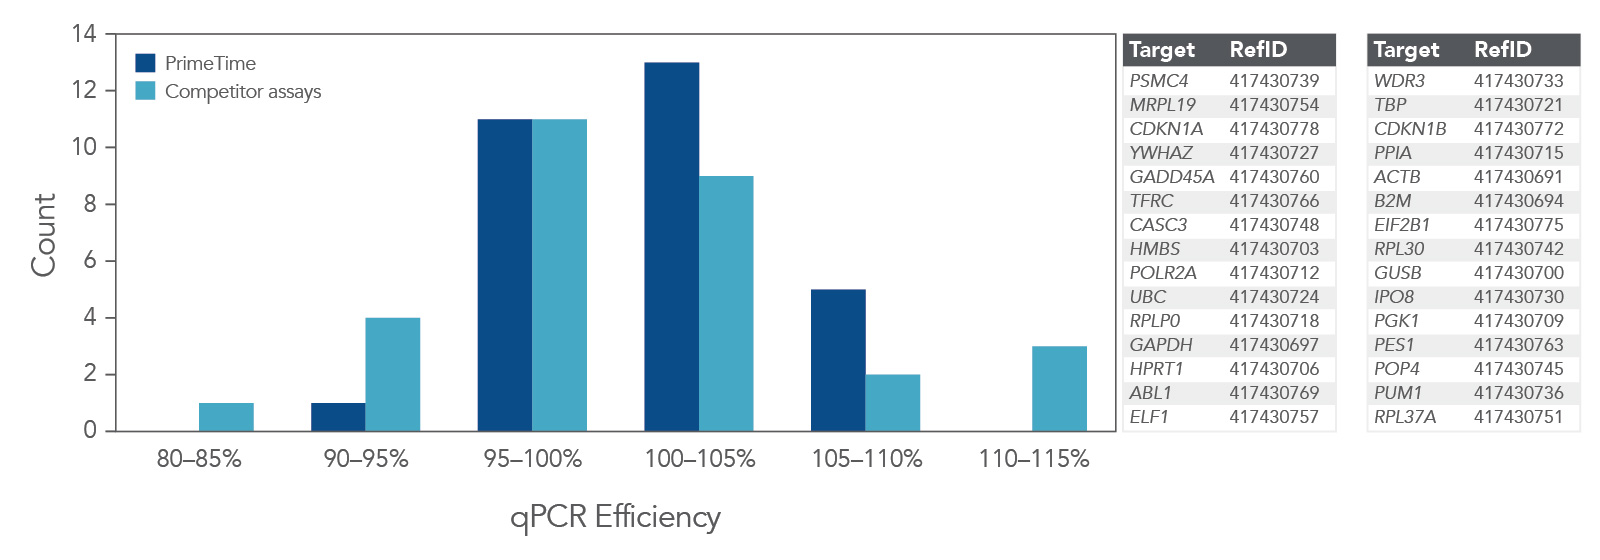
Figure 6. PrimeTime qPCR Assays have higher average qPCR efficiency and a smaller distribution range than Competitor assays. PrimeTime qPCR Assays were compared to matched Competitor assays using five, 4-fold dilutions of cDNA and the PrimeTime Gene Expression Master Mix. The reactions were run on the CFX384 Touch Real-Time PCR Detection System (BioRad) with the following PCR cycling conditions: 2 min 50°C; 10 min 95°C; 45 x (15 sec 95°C, 1 min 60°C). Identical thresholds were set for all runs for comparison across assays.
Resources
User guides and protocols
Brochures and flyers
Handbooks


Aids for fluorophore and quencher selection
Gene sets for common pathways
Frequently asked questions
How does the PrimeTime™ One-Step RT-qPCR Master Mix compare with one-step master mixes from other manufacturers?
PrimeTime One-Step RT-qPCR Master Mix performance in qPCR experiments is equal to or better than most other master mixes designed for one-step qPCR. Click here to view the representative data.
How long can I leave my qPCR master mix (containing PrimeTime™ Gene Expression Master Mix) at room temperature and still generate consistent results?
The stability of PrimeTime Gene Expression Master Mix makes it ideal for overnight PCR runs and high throughput experiments using robotic liquid handling systems.
Reliable results have been obtained when the qPCR was run directly after setup or after the reactions were maintained at room temperature for up to 72 hr.
Download the white paper, Ambient shipping of PrimeTime Gene Expression Master Mix for more data.
Why does the reference dye come in a separate tube from the PrimeTime™ Gene Expression Master Mix?
We provide a separate tube of reference dye so that you may use the PrimeTime Gene Expression Master Mix on reference dye-dependent or dye-independent instruments.
Also, the separate tube of reference dye provides a way to add a high or low dye concentration to the master mix, depending on the requirements of your instrument.
Does the PrimeTime™ Gene Expression Master Mix use a hot-start polymerase?
Yes, it uses an antibody-mediated, hot-start polymerase. During the initial denaturation step of qPCR cycling, polymerase activity is unblocked when the polymerase is released from the antibody.
This hot-start polymerase enhances reaction precision of the qPCR by avoiding non-specific amplification of DNA and primer dimer formation. It is therefore critical to follow the cycling conditions provided in the PrimeTime Gene Expression Master Mix Protocol.
Is the Primetime™ Gene Expression Master Mix compatible with different real time PCR instruments or systems?
Yes. The Primetime™ Gene Expression Master Mix has been successfully used in qPCR experiments run on the QuantStudio™ 7 Flex (Thermo Fisher Scientific), 7900HT (Thermo Fisher Scientific), 7500 (Thermo Fisher Scientific), the CFX384™ (BioRad), and the LightCycler® 480 (Roche) instruments. All such experiments used the cycling conditions provided in the PrimeTime Gene Expression Master Mix Protocol.
Reference dye is provided in a separate tube, so you may add it to the master mix at the levels required by your real-time PCR instrument.
Reference dye is provided in a separate tube, so you may add it to the master mix at the levels required by your real-time PCR instrument.
How much reference dye should I add to the Primetime™ Gene Expression Master Mix?
The amount of reference dye that should be added to the PrimeTime Gene Expression Master Mix depends on which real-time PCR system you are using.
A table that details how much reference dye to add is provided in the PrimeTime Gene Expression Master Mix Protocol.
How should I determine the annealing temperature for a probe-based qPCR assay? Should I select a melting temperature midway between my primer and probe melting temperatures (Tm)?
When performing qPCR it is ideal to have your probe Tm about 5−10 degrees higher than your primer Tm. The annealing temperature should be set 3−5 degrees lower than the lowest primer Tm.
Use this as a general guideline, but note that optimization may still be necessary.
What qPCR products does IDT ship at ambient temperature?
We ship PrimeTime™ Gene Expression Master Mix, PrimeTime qPCR assays, and other oligonucleotide products at ambient temperature.
Why might the concentration of reference dye need to differ?
Different thermal cyclers have different requirements for dyes based on the excitation capability of the light source. Thus, different instruments have variable requirements for reference dye concentration.
Please refer to your instrument’s manual for information about these specific requirements.
Why do my primers have deleted 3' bases in the amplified fragment when I use a proofreading enzyme for PCR?
Proofreading polymerases (Pfu, Diamond Taq®, etc) have been shown to remove 3' bases from PCR primers [1].
If you experience this problem, you can protect your primer from degradation by adding one or more phosphorothioate bonds to the 3' end of your primer.
Also make sure to add the enzyme last, after the addition of dNTPs, in your PCR to minimize the risk of this issue taking place.
Reference
1. Skerra A. Phosphorothioate primers improve the amplification of DNA sequences by DNA polymerases with proofreading activity. Nucleic Acids Res. 1992;20(14):3551-3554.
Which dyes are compatible with my thermal cycler?
To determine what dyes are compatible with your instrument, download our Real-time qPCR assay design guide or take a look at the PrimeTime™ Multiplex Dye Selection Tool.
Which dyes are available for use with the IDT ZEN™ quencher?
Currently, the IDT ZEN quencher is available with FAM, HEX, TET, Yakima Yellow® (ELITech Group), JOE™ (Thermo Fisher Scientific), MAX™, and SUN™ fluorophores. Double-quenched probes have significantly lower background fluorescence, especially for longer probes.
The ZEN quencher is available on PrimeTime™ qPCR Probes and on the probes supplied with PrimeTime qPCR Probe Assays. For any special oligonucleotide requests that include the ZEN quencher but are not found on our website (non-catalog requests), please contact us.
For more information, see our DECODED™ article, Double-quenched probes increase qPCR sensitivity and precision.
Where on a nucleotide are Cy® dyes attached?
5′ Cy dyes are attached to the 5' hydroxyl group of the sugar via a phosphodiester bond.
3' Cy dyes are attached to the 3' hydroxyl group of the sugar via a phosphodiester bond.
Internal Cy dyes are attached to the backbone via the phosphodiester bonds of the bases between which the dyes occur.
When preparing the qPCR reaction mix should I thaw or keep reagents (such as the Primetime™ Gene Expression Master Mix) on ice?
It is good practice, but not necessary to thaw or keep reagents on ice. We see no difference in results between reaction mixes prepared with the PrimeTime™ Gene Expression Master Mix that were used directly after thawing vs. those kept at room temperature for up to 24 hours.
PrimeTime Gene Expression Master Mix also shows exceptional temperature stability, even after a heat stress test (up to 8 hr at 55°C). Review the data in our white paper, Ambient shipping of PrimeTime Gene Expression Master Mix.
What type of purification should I choose for my qPCR primers?
Standard desalting is the recommended purification for qPCR primers.
RUO22-1558_003